Mobile App Analytics Tools – Boost Your App Business by 55%
You’ve come up with your dream idea that turns into reality. Yes, ‘I am talking about your million-dollar app which is in your hand.’ But, the work not done yet. In other words, it’s still incomplete without Mobile App Analytics Tools.
How will you assure that your app becomes famous and produce revenue? You may be trying to republish your app on a new moon and chanting’.
BLESSED MOON, RISE, AND SHINE,
ALL THE CLIENTS ARE MINE,
MONEY COME,
MONEY FLOW,
GROW,
My ROI,
GROW, GROW, GROW!
Anyone can’t guarantee this may work. It is the reason; Why Mobile App Analytics is a Must! APP ANALYTICS is the key to know how your MOBILE APP works and what can you do to improve it and attract new customers.
Completing the mobile app development process is only one phase! The second thing is how your app is performing into the market! At this point, a few QUESTIONS you need to CONSIDER!
- How do peoples will know about your app?
- What amount of time have they installed it?
- How often users run your app?
- What do they use it?
- How many goals have you set for your app? And how many goals achieved?
- Many more
Quick Tip 1
Mobile App Analytics Tools help to answer these questions and a lot of others. When you got all your answers, you can make your app more effective. You can improve your USER ENGAGEMENT, RETENTION, EXPERIENCE and reduce acquisition cost, etc.
Mobile Application Analytics is a crucial thing to know how your mobile app works and WHAT can you do to attract NEW CUSTOMERS or users!
Here in this article! Here I will examine the top 10 Mobile App Analytics Tools and how it will help you to attract more customers. I will take a closer look at Android and iOS App Analytics like;
- What to start?
- What to know in implementing the app analytics?
Now let’s move to the categories of Mobile App Analytics! Generally, there is not a prescribed category for IN-APP ANALYTICS but, in my point of view, I will divide it into three major sections.
- In-App Analytics
- A/B Testing
- Advertising Analytics
These are the three essential sections of App Analytics that I am going to discuss below! The first section is In-App Analytics, which is very much necessary to growing your BUSINESS consistently. Let’s go through to know how it will help to enhance the USER ENGAGEMENT.
How to Boost the Conversion from 25% to 50% Using In-App Analytics?
It is a significant form of the Mobile Application Analytics deployed by the products and MARKETING TEAM. For the app owner who is hoping to get more than a pulse on their client base! Such as blood pressure, respiration, vitals, temperatures, etc.!
In-app analytics is their mainstay! In-App analytics furnishes app teams with the
‘What,’ ‘Who,’ ‘When,’ ‘Where’ and ‘How’
of user behavior.
What
In this section, you can Identify what the USERS are viewing into your app.
- It will provide you with a context; what are the required features?
- Digging into the data will allow you to see a verity of FEATURES, which screens are viewing more by your users.
Who
- Guys, this is very crucial points that you must know. Because it will help you to create and refine your valuable CUSTOMER INFORMATION.
- By using DATA, for example, age, location, gender, interests, device type, and activity.
- It helps you to categorize USERS into the various groups.
- It will lead to performing a COHORT ANALYSIS (Cohort Analysis is a tool that will help to measure and monitor user engagement over time. Also, it will help you to understand whether the user engagement becomes better over time or is just appearing to enhance because of growth — ) for the targeted marketing CAMPAIGNS.
- In-App analytics innovations may also capture KEY revenue data.
When
- Observing what TIME, a user engages with your app!
- It will help you to understand how your app will fit in the user’s cycle of daily life.
- Do the users check the app in the morning time before the starting of the day? Or do they engage during everyday activities?
- Frequency is a different KEY INDICATOR of the behavior of the user- knowing how sticky the app!
- It will show you how dedicated to, or contingent upon the users are?
Where
- Identifying the location of your users.
- It will help you to begin the critical marketing efforts between the best engagement screens.
- You can target your USER by their geographical area!
How
-
- The device type and OS give you an insight into how they structure their testing and issue users are facing.
- Moreover, your users may use your APP in Wi-Fi or mobile data!
- If your APP isn’t working well on a few devices, at the point, they may use the data to know what issues are occurring?
Know the Major benefits of In-App Analytics
- Product – ‘Analyze a user’s behavior and understand the usage patterns.’
- UI/UX Designers – ‘Analyze the user’s flow and figure out bottlenecks or spoilers’
- Developers – ‘Analyze high traffic time to optimize server performance and product updates.’
- Quality Assurance – ‘Identify the dropping off and know the points of failure. Observe the prominent device types for testing purposes’
- Marketers – ‘Analyze the user’s growth and observe opportunities to increase loyalty. Observe engagement windows to the nurturing app users’
Quick Tip 2
Once you integrate the app with In-App analytics, then you will get the behavior of your users from day 1. Moreover, you can make changes accordingly! If the user doesn’t like something that is not so useful in it.
A lot of peoples didn’t understand why their app is not growing, where the users are stays or what FUNCTION they love most and what they don’t!
They are unable to figure out correctly to know the BEHAVIOR of the user, because, they didn’t utilize In-App analytics or those who integrate it after some time of its launching.
Which In-App Analytics Tools Are Best? Any, Pick One!
One is best than none. However, Try Many.
There are lots of analytics tools out there. What I would recommend is that you pick one that you feel good using, i.e., simple, quick, easy, and provide you an accurate data.
I honestly know there are some arguments which having many analytics codes in your mobile app. It may slow it down, and this will have merit yet it’s only for a short period, and at the end, you have skills and experience with an analytics tool that you want to utilize and be able to compare every App Analytics Platform.
How to Figure out the Best In-App Mobile app Analytics Tool?
Okay Because I want you to start using any Mobile App Analytics Tools. Here I have mentioned a list of analytics tools, rates and where will you get it from:
Best In-App Analytics Tools
Google Analytics
- Price: Free
Mixpanel
- Price: Free
Kissmetrics
- Price: Paid ($500 to $1,000+/month)
Localytics
- Price: Paid (Premium = $95, Enterprise = $895 Enterprise, Analytics and Marketing edition = $1,790)
Flurry
- Price: Free
I tend to suggest Mixpanel to the clients as you will get granular information and data and it has ‘Push Message’ features as well. So, you won’t need to have two kinds of code in your app. Hence keep your app as fast and quick as possible. Thus, this is one of the best Apple App Analytics Tools.
Moreover, you can make your Mobile App Analytics comparison to choose the best Mobile App Analytics Tools for your app.
Google Analytics is Okay, and sometimes it’s better than nothing! However, the data, it provides you a pretty limited functionality and frankly it’s not very actionable. But, it is not as bad if you are using Google Analytics. It is one of the best tools to monitor your app performance.
Now the Question is HOW TO VIEW YOUR IN-APP ANALYTICS?
Let’s find out!
Here I have described the example for Mixpanel Analytics read the below post to know more!
With Mixpanel In-App Analytics you will see what users are using once they download the app.
There is nothing to do except you need to Select the module that you can see under Tools and Custom Pages and then Save it.

Once you have Select the Module, then compile your app and publish it to the app marketplace (either IOS or Android) you will see the stats in the Tool Bar of your App. Then click on the Analytics icon.
Then, an Analytics page will be open where you will see detailed analytics of all your apps.
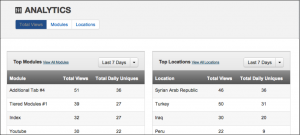
You may select the stats by location or by modules. If you need to see the graphs of the data, then click on the given tab. For example, here is the diagram of a module which you can see within a week:
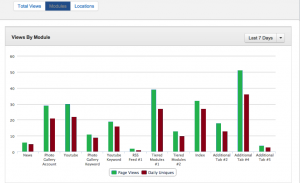
As you can see each module is listed
If over some time, you see that users are not viewing a module, you need to update your app, by removing that module. Might be your users are not interested in that module.
But you can replace it with some other module to get the one which is more prominent. You should test your app frequently. It will help you to understand which functions or features your users love most.
So, I hope you cleared with the concept of In-App Analytics. By this, you can monitor your user behavior in your app. You will know all your app WEAK POINTS that will help you to make required changes to catch the users engagement.
After you see the behavior of your users and you want to know where you can make some changes that help to drive more TRAFFIC!
Well, there are a lot of features available in Mixpanel which I will discuss in my upcoming blogs. Hence, if you are looking for such kind of work or you are planning to hire a mobile app developer for your app, at the point you can reach us.
We at Chromeinfotech, having a team of experts and professionals who are well experienced and knowledgeable. We can provide you with a complete solution for your app. Consult today, and we would love to help you.
At the point, you have to MOVE to the next step ‘A/B testing.’
How to Boost Your User Engagement by 38% Using A/B Testing?
As per the Statista, there are 2.1 million apps in the Google Play Store and the Apple Store is the second biggest App Store with approx. 2 million apps.
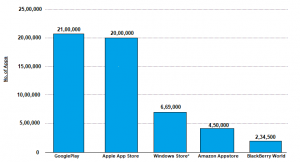
As you can see in the above picture graph, google play store is having 21,00,000 apps till 2018 whereas Apple Play Store is the second contestant with 20,00,000 apps that are available.
So, let me come to the point! You are going to participate in 21 million apps, and your competitors are already there to make you lose. You will have to prepare before jumping in the battle. So, be ready for it and keep everything in your mind before launching your app.
Once you have LAUNCHED your mobile application, it is essential to provide your user with what they want, not like what you think they want!
But, the QUESTION is ‘How will you know?
Usually, there are many METRICS available to measure!
How it’s possible for you to begin with the best strategy for this TASK?
It’s a time where Mobile A/B Testing is handy. It is a TECHNIQUE to test two or more elements of your app, and the result will allow you to select the best one for the audience.
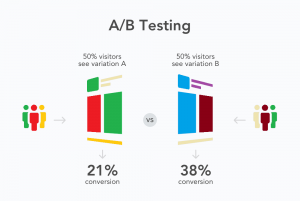
Let me clarify by the EXAMPLE of the above picture! As you can see in the movie; where 50% of visitors are seeing the “VARIATION A” and 50% of visitors see the “VARIATION B.” As you see, the rate of conversion was 21% But after applying A/B testing, conversion rate increased from 21% to 38%.
A Question May Come to Your Mind! WHY?
BECAUSE changing the screen color and banner would effect on user’s behavior. Peoples always want to see something NEW!
The Solution of A/B testing lets you statistically validate several HYPOTHESES, yet alone, it can’t give you an advanced understanding of the behavior of your user. However, understanding the behavior of your user is the KEY to resolve the issues that occur with the conversions.
Let’s pick another example;
For example, you have an E-COMMERCE MOBILE APP for branded clothes and footwear for men and women. And you need to test the different BANNERS for your app in order to see which banner is clicked on the most.
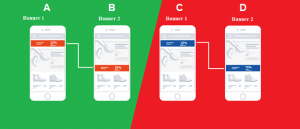
I am going to take an EXAMPLE of the above picture; there are four kinds of banner in two different colors. Where Banner A1 and B2 is the part of “A Test” and Banner C1, and D2 is the part of “B Test.”
- In Test A, here, we can see the banner A (1) appears at the top in RED color. And it produces 25% TRAFFIC but when you change the banner position (from top to bottom in B2), then the traffic boost to 50%.
- Here in Test B, I have changed the banner color, but the position will be the same, (as you can see in C (1)) a BLUE color banner that appears on the top is producing 35% traffic but when the banner position is changed (as you can see in D2), then the engagement boost to 75%.
By applying A/B testing, you will be able to understand which banner PERFORMS the best by their actual users.
The major mistake when doing A/B testing is BLIND testing without the proper research base. While checking your mobile application, it is essential to understand clearly what are the demands of peoples, rely on keen product DESIGN and keep testing until you get the best results.
Now, let me tell you the major points to keep in MIND while you do your mobile A/B tests.
Follow these 5 Mobile A/B Testing Practices to Line-up Your Business
Here, I have described several GUIDELINES for your mobile A/B testing strategy to get the best result. The steps are associated one with others and following them! The app owner will get what they want and would have the best product for their users.
Let’s collect these 5 IMPORTANT elements
Five Important A/B Testing Practices
- Put Yourself into your User’s Shoe
- Connect with your Users
- Make a Proper Plan
- Be Patient
- Decide What You Want to Test
Put Yourself into your User’s Shoe
It is a beginning step in any action that has made in the mobile world. It’s crucial to look at your app from the user’s point of view. Note every detail and begin with small changes and observe them.
Connect with your Users
Always be in touch with your users. Because you don’t know what they want! You have to ask them the feedback. If you don’t ask, you may not be able to understand what to test and why?
Make a Proper Plan
Confusing? Let’ take it more simple! Complete planning is required to make your app success. What is the PLAN?
P – Position – See your app position in your App Analytics Tool.
L – Level – Set the level of your app where you are focusing.
A – Actions – See the actions and activities of your users.
N – Network – See the demographic from where you are getting traffic.
As I have stated, Once you have decided you want a mobile A/B testing, it is essential you must have a plan! You should decide how things will run and what result you are expecting.
If you don’t have an idea what are you looking? You will be unable to get the end of it.
Be Patient
If you are expecting the result, then you have to run those test! At least three or four weeks. If you need the answer instantly, then you will have to reconsider the A/B testing idea for your mobile app.
Now you know about the science of in-app A/B testing. I hope the above post will provide you with a depth understanding of feature-based A/B testing. More than that, there is another phase of A/B testing that can enhance the downloads and installs of your app which is known as App Store A/B testing. In this phase, I am going to discuss how can you drive visitors on your app page and increase the number of downloads.
How Will You Boost Your App downloads by 40% to 80%?
The concept of App Store A/B testing depends upon the following mentioned highlights. As you may listen to a thought –
‘SMALL THINGS CAN MAKE A BIG DIFFERENCE’
Yes, it’s true! Because you have worked hard on every significant thing to make your app impressive and excellent. But, you may have ignored some crucial elements that need to complete!
Are you Confuse? Let me clarify!
- Visitors of the App Store will download your app only when they examining everything; they stay on your app page. And they will figure out the portfolio, screenshots, descriptions, app logo.
- You need to tell your app story in a very creative way because the user will stay on your page for just 20 to 40 second and you must provide a description that can make them download your app.
- You must place a video of your app along with some screenshots. It will make the user’s mood to download your app.
While optimize media spend and the budget of app marketing, the publishers will have to test the functionality and creativity of your app before launching a campaign.
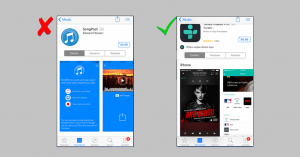
For example
As you can see in the above picture, there are two screenshots of two different apps! The first screenshot of SongPost pp not much attractive.
As you see the logo, screenshots are so simple, and this is the main reason it doesn’t have any review and much downloads.
It’s not mean peoples are not visiting the app page, yes they are visiting but then gone. The bounce rate is high in SongPost. Because of the app, SongPost didn’t apply A/B testing that’s why it looks not more complexed.
Whereas ‘TUNEIN’ looks impressive. And attract the users to download and install it. TUNEIN has an appealing logo with great screenshots and reviews.
These things attract the user and force them to download the app and check its features.
Keep in mind the mentioned elements to test different app page ideas
- Icon
- Video Preview
- Screenshots
- Title
- Description
- Pricing
By examining these elements, you will boost the number of downloads for your app in the Apple App Store or Google PlayStore.
I advise you to go along with both of the tests (Feature-based A/B testing and App Store A/B testing) separately.
If you have done everything with the guidelines, you will see an appealing result for sure.
After this, let me tell you how important is A/B testing for your app!
Here we go!
If you want to succeed in the marketing campaigns, then you need to follow the advice that I have described in this blog! It is essential, and lots of best advertisers or promoters are using A/B testing in their methods.
Here, I am going to discuss some crucial points that support this method to enhance the downloads and for gaining an essential element that is user retention.
Quick Tip 3
In the development of your app, A/B testing is the act of fragmenting out application parts, for example, pages, UIs or features and contrasting the several versions to figure out which approach will work best.
Let’s understand by the below example –
CTR (Click-Through Rate) increased by 49% When Adding Text in ‘Call-to-Action’ (CTA) Button
A Test carried out by FAB!
Let me tell you FAB is an online e-commerce store where you can buy or sell home goods, apparel, collectibles, accessories, etc.
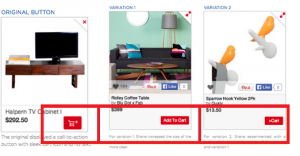
They modified the button ‘Add to Cart’ by adding text instead of an image or symbol to make it more transparent and visible! It helps to enhance the number of users adding the items into their shopping carts.
Result: 49% CTR enhanced over the original (after the text ‘Add to Cart’) option added to the CTA button instead of a symbol or image.
As you can see in the image below, their original design featuring a little shopping cart along with the + icon and without text. Options use into the A/B test were buttons along with the Add to cart and + Cart text on it. The two variant (middle and right) include text-based designs. Modification 1 helped boosts cart adds by 49% over the original.
What You Learned from this:
Text connects much better with the visitors instead of images or symbols that may disturb them. Hence, try and have a straight and clear CTA that will help users know of their activities.
It doesn’t make any sense to have a CTA which, your visitors unable to understand. They do not understand to grasp what the button does actually.
Now, you know the science of A/B testing! Here a question may pop-up to your mind.
How to apply A/B testing and What are the Best iOS and Android App Analytics Tools are available in the Market?
Let me tell you; there are two ways if you want to do an A/B testing for your product.
The first case
If you are not friendly with development, coding, and tools, then you can contact the best App Development Company to do A/B testing for you.
As Chromeinfotech, we are offering the best and high-quality service by the certified pro developers who can give you an appealing result in a reliable manner. Get in touch today before someone hack your idea.
Just reach us by visiting our website, and we will do all the needful.
The second Case
If you are a pro developer and you know analytics tools a bit, then you can proceed with the below procedure. I have mentioned the step by step guide which will help you to perform A/B testing for your app.
You can prefer which option is best for you.
So, A/B mobile testing is a very effective way to measure and apply the required changes and it’s beneficial for your app traffic. With this, you can boost your user engagement from 20% to 50%.
Here I have mentioned some crucial points of A/B testing for mobile apps. I hope the above information provides you with some information about A/B Analytics, how to use and their benefits.
Now, I am going to discuss the third category Mobile Advertising Analytics. How will it help you to drive more users? Follow the below write-ups to get the answers to your questions!
How Mobile Advertising Analytics Will Enhance 40% User Engagement?
The best marketing strategy which is most overlooked by pro marketers is Mobile Advertising Analytics.
I see peoples think the mobile ads comprises of flashy and annoying banners on the mobile phones that produce accidental clicks. However, the truth is, mobile ads are continuously advanced and progressed when we are talking about quality.
So, marketers have lots of mobile ads options at their fingertips, and there is much money to be made doing it.
As per to Addage, the revenue of online Ad is $88 billion, a 21% upswing from 2016 and the income of mobile As enhanced by 66%, that is more ten times more than computer ad’s growth.
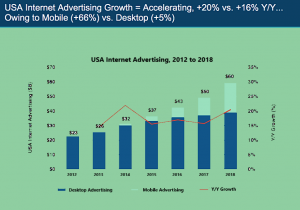
There is a significant mismatch amid the level of impact which the mobile advertising may have for a particular brand and the level of investment which the entrepreneurs are putting into it.
People are using 25% time on their mobile phones, but in the case of businesses, they are just putting 12% ad budgets towards your mobile advertising.
More than that, the consumers are spending 22% of their time on computers, and the advertisers are investing their 23% budgets on advertising on that platform.
Keep in mind the context within that users will be seeing your ads:
- 33% of users are accessing their mobile phones at home
- 27% of users are accessing it into the public place
- 23% of users are accessing it when traveling or in roaming
- 17% of users are accessing it when at work
Additionally, you need to think about how you adapt the advertising techniques for the mobile environment: you have a smaller screen in size to work with (so no short text!), the mobile users tend to have a lower attention span, and interruptions are less appreciated than on computers. Moreover, tablet users are expecting the best quality creatives as well as visuals while viewing the content on their tablet vs. some other devices.
Knowing this small information will help you to create a high converting mobile ad campaign.
Did you know?
The mobile marketing association or MMA is a non-profit world trade association, which fosters mobile marketing advertising innovations. It regulates related terms, best practices, and specifications. MMA also manages the global mobile advertising units in Apps, messaging, TV, and on the web.
Mobile advertising depends on some following ways;
- Mobile Web – This section involved in mobile web banner ads, text tagline ads, and rich media ads
- Multimedia Messaging Service – It involves long and short text ads, rectangle ads, etc
- Mobile Application – Here you will get in-app display ads unit, banner mobile apps, integrated ads, etc
- Mobile Video and TV advertising units – Here in this section, you will get linear and nonlinear ad breaks and interactive mobile video and tv ads
What Social Media ROI Means and why you measure it?
There’s a courageous principle in the world of digital marketing:
If you do not measure/figure out the results of your activities, you’ll be unable to know whether they’re working or not.
So, what is a Social Media ROI and Return on Investment deals along with knowing how powerful your campaign is on social sites?
Here I have pointed out five essential solutions which advertisers may utilize to grab the details about their mobile campaigns.
AppsFlyer
- Used to improve the understandings of your mobile campaign efficiencies.
Servo
- Used to appropriate count all mobile.
Kochava
- Used to track the location-based events into the dashboard of your mobile analytics.
InMobi
- Used to pinpoint the excellent mobile opportunities
Adjust
- Used for the Business intelligence of mobile app advertisers/marketers.
In short, mobile advertising analytics will help you to show and track the ad campaign on the mobile app.
By choosing the right ad format and the right metrics to measure, you could be one of the few marketers who is taking full advantage of mobile advertising before the majority.
By reading the above article, you know the phenomena of Mobile App Analytics Tools and its functionalities and features. Here, let me tell you 10 most useful and beneficial Mobile App Analytics Tool that will be helpful to make your app a hit.
Let’s discuss –
Grow Your Business Income Using these 10 Mobile App Analytics Tools
You can find a lot of Android App Analytics Tools, Web App Analytics Tools and Apple App Analytics Tools that is available on the web. Some of the tools are free, and some are premium.
Most of the mobile app tracking analytics tools specified below may need a mobile SDK download and some little customization. So, you may integrate with your app and experience the performance of the app using binocular.
Here I have described 10 best Mobile App Analytics Tools which are using by most of the Mobile App Analytics Companies like us Chromeinfotech; we are using for our clients. Go through to know the best Mobile App analytics tools and the reliable Mobile App Analytics Platform. Do have a look!
LOCALYTICS
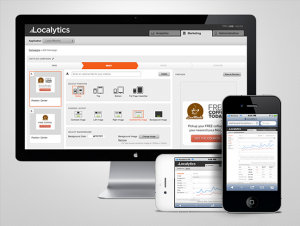
LOCALYTICS is a type of handy tool for mobile app developers. A software development kit is also available for the developers as per to the business needs. After integrating the app with the localytics, you will see an overview of your app on the main screen.
What Features LOCALYTICS Will Provide to Your App?
Localytics is usually a marketing analytics tool. And it allows you to enhance the user engagement by three crucial factors of iOS and Android app usage analytics-
- Useful Insight
- Smart Targeting
- Marketing Automation
It is one of the best Mobile app Analytics tools that will provide you the all the data in a very reliable manner.
- Price | Free + Premium (you can get in touch with LOCALYTICS to know the price)
- Platform | Android, and iOS
FLURRY Analytics
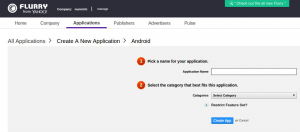
In 2015, FLURRY was a part of the Yahoo mobile developer suite. It was standout amongst the best Android and iOS App Analytics Tools. More than 2,50,000 developers are using FLURY Analytics into the 8,00,000 apps and 10 billion sessions every day.
FLURRY Analytics used to measure-
- Audience Reach
- Conversion Rates
- Revenue
- User Engagement and many more.
The ideal part of FLURRY is, it will take a concise time to integrate with your app. Moreover, you only have to enter the app key to the main code.
What Features FLURRY Will Provide to Your App?
It will be using as a tool of marketing because this App Analytics Software provides a depth insight into the user experience in real time. Additionally, you get information about how the advertising campaigns are achieving grounds.
- Price of FLURRY | Free
- Platforms | Android, iOS, Blackberry, Java Me, Windows Phone
Google Analytics
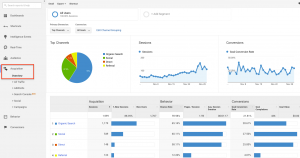
Google analytics wasn’t offering its features to the mobile! Additionally, it was accessible in the beta version in the year 2014. But, now it’s providing the services to mobile as well. You will get a separate dashboard for your app analytics. Where you can measure the speed, behavior, and features of your app, now use your Google Analytics App Install Tracking and enjoy the benefits.
What Features Google Analytics Will Provide to Your App?
Google Mobile App Analytics Tool is a beneficial tool for all the purposes of your business. Be it gaining information about your app marketing, business growth and so on.
It is beneficial for users who use any devices. Google Analytics for mobile apps is safe and secure.
Moreover, it is necessary for a user to create the account and start the analysis on various metrics. Also, this is one of the best web and Mobile App Analysis tools on the internet.
- Price of Google Analytics | Free
- Platform | Android, iOS
COUNTLY
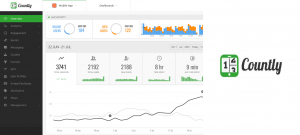
Same as FLURRY, COUNTLY provides depth information on how a user is using your app. Right from the button, you can click to swipe the screens to the time duration the user spent on your app. COUNTLY analyzed all the information of the app movement and saved it into the database.
What Features COUNTLY Will Provide to Your App?
COUNTLY is an open source Web Analytics Tool, and it is accessible for free. COUNTLY tool additionally added an Enterprise and Cloud Edition features that is admirable.
- Price of COUNTLY | Free
- Platform | Android, iOS, Blackberry, Windows Phone
App Annie
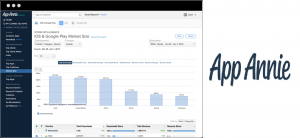
App Anny helps you to track the insight on your app revenue, downloads, rating, reviews and a lot more. Generally, it gleans every one of the essential data from various app stores on your behalf. Furthermore, it will offer you an opportunity to stay updated with the most recent trends.
The price can be varying, relies upon the necessities and requirement.
For example, it helps you to glean the app store statistics for free. Whereas for the enterprise intelligence and mid-market intelligence, the price will differ. You can get in touch with the App Annie experts to know the prices for these two statistics.
What Features App Annie Will Provide to Your App?
App Annie is an exciting tool which lets you relax, and it will work on your behalf. It comes with an excellent dashboard that provides in-depth information about your app.
- Price of App Annie | Free + Premium
- Platform | Google Play, iOS, Mac Store, Amazon App Store
APPSEE
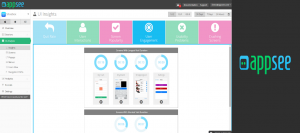
APPSEE will help you to understand a user experience along with visual. Once you click the button, you will see the time duration spend by a user in your app. It monitors and captures everything.
It’s like a magic tool for developers; they will know how and why the app is crashing. They also can check the crash records via visuals. It will help the developers to understand the actual reason why the app crashed.
What Features APPSEE Will Provide to Your App?
APPSEE provides per-user tracking system besides tracking the summary of the aggregate data. Moreover, the visual concept to analyze each event in detail!
- Price of APPSEE | Free with limitations. You can contact APPSEE for the standard rates
- Platform | Android, iOS
Bango
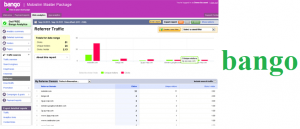
Bango is one of the different app analytics and can integrate with various app platform. It will help you to track the revenue metrics that is very useful for the growth of your business.
What Features Bango Will Provide to Your App?
Bango Dashboard data help you to track the basic revenue patterns. It will also foresee how the app is utilizing.
Because it is the best tool to track your marketing campaigns and provide depth insight, additionally, this will help you to understand how can you enhance the payment revenue and user engagement of your app.
- Price of Bango | You can contact Bango for the price
- Platform | Windows 10, Google, Samsung Galaxy Apps, Amazon.com, Windows Phone, Blackberry
AppFigures
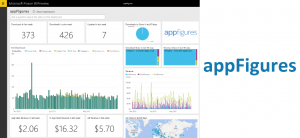
AppFigure can track all the data of your app at one place. It enables different users along with various access level and customized dashboard.
For developers, the most exciting thing is, there is no need to download any mobile SDK! Here you only have to use the AppFigures API into the code and get the experience of the app performance.
Generally, AppFigures is having three kinds of price category.
Basic – Free for a lifetime and you can track the data of 5 apps.
Premium – The charges are $4.99/month + $1.99/app. The first two apps will be free. It includes a lot of features as compared with the basic.
Enterprise – The charges are $2.99/month. Especially for those professional developers who tracks at least 1000+ app in a whole month. A team of five mobile app developers may avail the benefits of the enterprise.
What Features AppFigures Will Provide to Your App?
AppFigures give you alerts about your new app reviews. It will also provide you with an option to choose a kind of reports that you need to get alerted.
It will share the review of your app into a peaceful card. These cars had an inbuilt link with app analytics and automatic translation.
You may export the analysis into any of the formats. You can save the critical analytical reports with the pinned view for the future study.
- Price of AppFigures | Price Variations
- Platform | Google Play, Mac Store, iOS, Amazon App Store!
Mixpanel
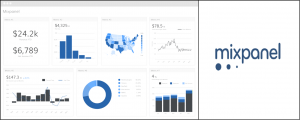
Mixpanel is a fantastic app analytics tool that caters events. It will help you to pick an activity to understand the performance of your app.
What Features Mixpanel Will Provide to Your App?
Mixpanel provides you with an insight to understand how to make app performance better? By tracking the analysis of your app actions, not the page views.
- Price of Mixpanel | Free + Premium
- Platform | Android, and iOS
Amplitude
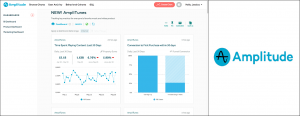
Amplitude is one of the reliable tools that provides analytics on the behavior of the user. It provides you with accurate data analysis to know where your user is facing problems. By this, you can improve your app performance better than before.
Amplitude comprises of different price categories by your requirements;
Basic – Free for a lifetime! You can tracks up to 10 million apps.
Premium – As the starting price is $2000/month. It also gives a high volume of data and involves basic + premium features.
Corporate – The price may vary upon the necessities. Thus, you can get in touch with the Amplitude for more information. If you choose the corporate plan, at the point you have entered into a gate of benefits. You can track high volume data + your user behavior as well. But, additionally, avail the extended features that involve both corporate and premium plans.
What Features Amplitude Will Provide to Your App?
Same as Google, Amplitude also gives analytics for both mobile and web. The integration provides you with a whole vision of your user count by using your app in various devices.
- Price of Amplitude | Free + Premium
- Platform | Android, and iOS
Conclusion:
It was a quick tour to introduce the Mobile App Analytics and 10 best Mobile App Analytics tools for all time. All the tools have tasted by Chromeinfotech, and I can say they are amazing. You can get the best mobile app analytics comparison here.
Also, you may choose any of the tools which are the best and appropriate option for your business. Find the best Mobile App Analytics Services and avail the hassle-free service. Do share your thoughts and suggestions if you feel suitable. Admittedly, I will discuss those points in my next blog.


 +1 (512) 3331-934
 +44 (161) 8188-928
